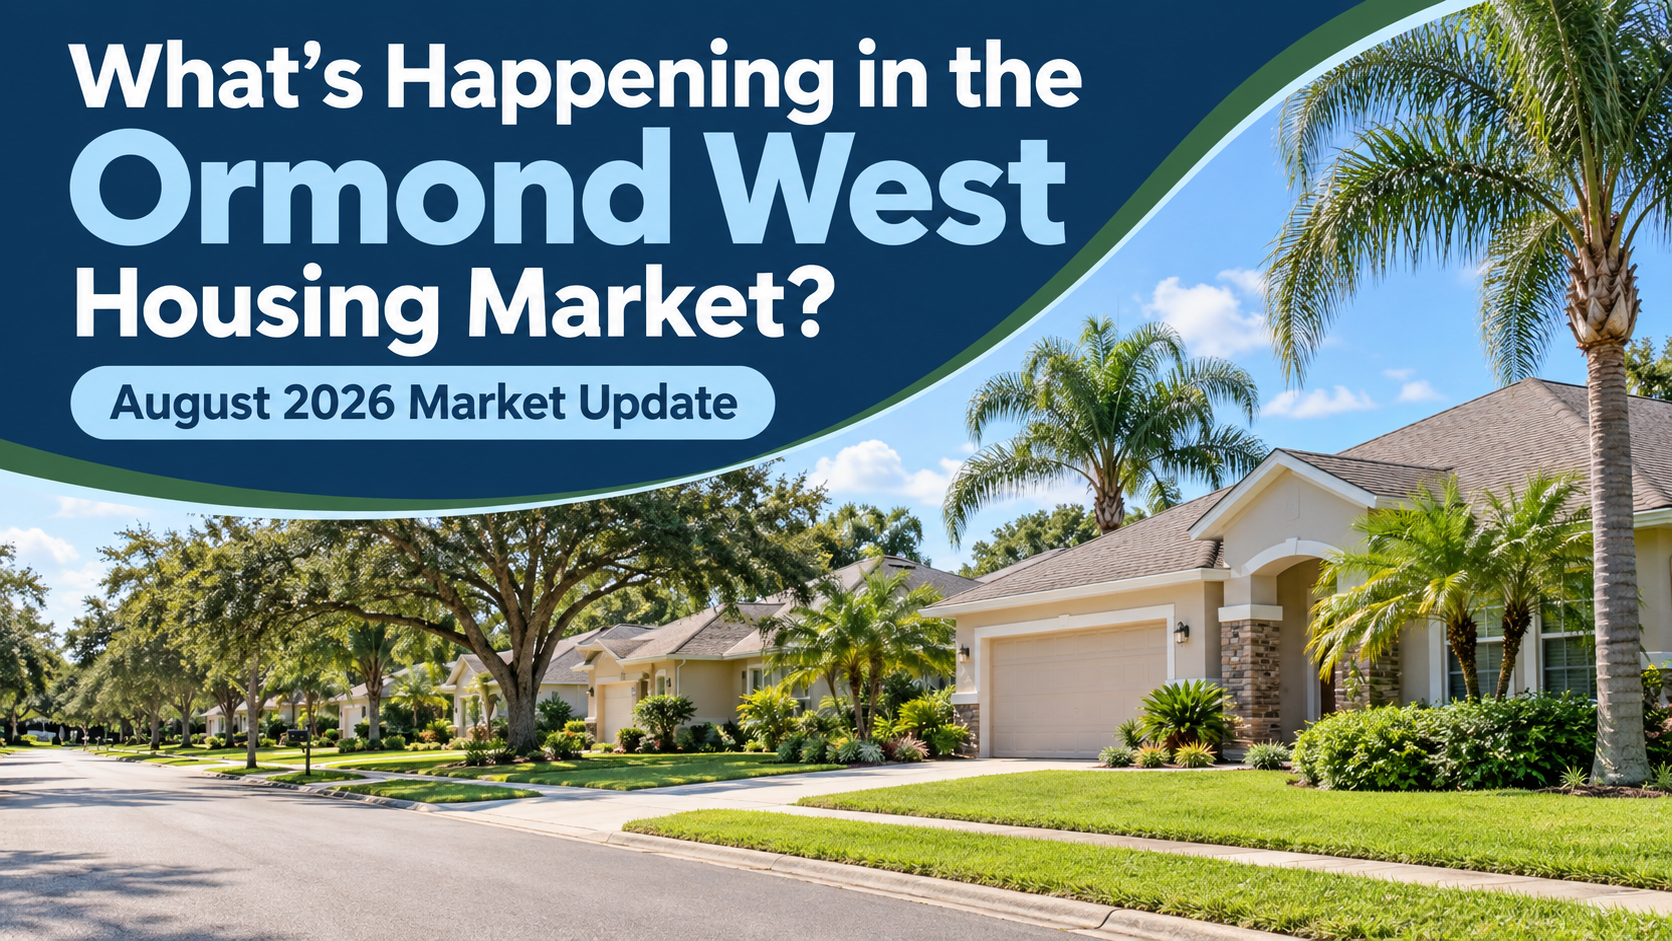
Real estate numbers can feel boring and confusing—but they can tell us something important about what is happening in our local market.
I compared the Ormond West housing market from August 2026 to August 2025, and here is the biggest takeaway:
Home prices stayed fairly steady, fewer homes were available, and homes sold faster than they did last August.
In other words, the Ormond West market isn’t skyrocketing, but it isn’t crashing either.
The numbers at a glance
| What changed? |
August 2026 |
August 2025 |
| Typical sale price |
$354,995 |
$350,000 |
| Average sale price |
$462,350 |
$429,030 |
| Typical time to sell |
55 days |
65 days |
| Available housing supply |
4.48 months |
5.74 months |
| Typical asking price |
$370,995 |
$375,000 |
Home prices remained steady
The typical Ormond West home sold for $354,995 in August 2026, compared with $350,000 one year earlier.
That is an increase of about $5,000—or 1.43%.
You may also notice that the average sale price increased by almost 8%. That sounds dramatic, but averages can be pushed higher when several more-expensive homes sell during the month.
For most homeowners, the median—or middle—sale price gives us a more realistic picture. Based on that number, Ormond West home values were relatively steady.
Of course, this doesn’t mean every home increased by 1.43%. Your home’s value depends on its neighborhood, size, condition, upgrades, lot and nearby sales.
There were fewer homes available
Ormond West had about 4.48 months of available housing supply, down from 5.74 months last August.
Simply put, buyers had fewer homes to choose from.
That is generally good news for sellers because there is less competition from other listings. However, buyers are still paying close attention to price and condition. A home can still sit on the market if it is priced too high.
Homes sold about 10 days faster
The typical home took 55 days to sell in August 2026, compared with 65 days in August 2025.
That is encouraging for sellers, but it doesn’t mean every home sold within 55 days. Some sold much faster, while others took considerably longer.
When we look at all of 2026 so far, the typical market time is still about 90 days—the same as it was during the same period in 2025. August improved, but buyers are still taking their time with certain homes.
What does this mean if you’re selling?
You may be entering the market with fewer homes competing for buyers’ attention. Homes also sold faster this August than they did last August.
But buyers are not purchasing everything they see.
Homes that are clean, well-presented and priced correctly are more likely to stand out. Pricing a home too high at the beginning can still cause it to sit on the market—even when inventory is lower.
What does this mean if you’re buying?
You may have fewer homes to choose from, but you don’t necessarily need to panic or rush into a decision.
Some sellers may still negotiate, especially if their home:
- Has been available for several weeks
- Needs repairs or updating
- Recently had a price reduction
- Returned to the market after a previous contract fell through
- Is competing with new-construction homes and builder incentives
The amount of negotiating room will depend on the specific home.
So, who has the advantage?
The Ormond West market appears fairly balanced, but the answer can change depending on the neighborhood, price range and condition of the home.
A well-priced home in great condition may give the seller an advantage. A home that has been sitting or needs work may give the buyer more negotiating power.
That is why broad market numbers are a helpful starting point—but they don’t tell the entire story.
Wondering what these numbers mean for you?
If you’re thinking about buying or selling in Ormond West, I can help you look at the recent sales and current competition in the specific neighborhood you’re considering.
There’s no pressure and no confusing real estate talk—just a straightforward look at the numbers so you can make an informed decision.
Nicole Comenole
Licensed Florida Real Estate Broker | BK3430169
LiveOrmondWest.com
This report compares August 2026 with August 2025. The statistics come from a custom MLS map of the Ormond West area using Pathways Elementary School as a geographic reference. This is not an official neighborhood or school-zone boundary. Information is considered reliable but is not guaranteed.